I have recently come across this great FREE tool from Microsoft called Clarity, a user behavior and website debugging analytics tool unlike any other.
What Clarity does is provide useful insights into how users interact with and use your site in realtime, making it completely different from other analytics tools, including Google Analytics.
For years Google Analytics has been the leader in the analytics market with it’s free google analytics platform. Its dominant role in providing website operators with analytical visitor data has put it at the forefront of website usage analysis.
Microsoft is now set to change the game with its own completely free UX analytics tool that can record and show you exactly what users are actually doing on your website. Microsoft Clarity, provides engagement metrics, recordings, heatmaps, and website performance data that will help you improve user experience and design across desktop and mobile screens with real evidence and it allows you to do so in a way that helps to respect your users’ privacy and data security.
Features at a glance:
- 100% Free Forever
- Easy to add to your website
- Manage multiple projects and teams
- Integrates with Google Analytics data
- Unlimited recording & heatmaps
- Recording storage for 12 months
- GDPR and CCPA compliant for privacy
- A/B testing through integration with AB Tasty
- Traffic filters by source/campaign
- Google Optimize integration (they have informed me this is coming in the next couple of weeks.)
Microsoft Clarity Basics:
With Microsoft Clarity, website owners no longer have to pay for expensive solutions like Hotjar, CrazyEgg, or Lucky Orange to gather website visitor metrics to enable them to make useful and relevant changes to their website to improve the user experience (UX), while still respecting your users’ privacy and being fully GDPR compliant.
The goal of Clarity is to make user analytics easy. When your users experience on your website can be monitored and viewed visually it can provide a much clearer picture of why your visitors bounce (leave your website immediately), time spent on site, the pages they visit and how they navigate around your site.
As a website/business owner, understanding the behavior of your visitors is very important to improving conversion rates and turning your visitors into paying customers. With Clarity, you can get an inside look at how your users behave while they are on your website without having to sort through a lot of data that you might not be interested in or even understand.
Additionally, you will be happy to hear that Clarity is designed to have a very low impact on your websites performance. This means that your users aren’t going to have to wait longer for your website to load. With no restrictions or limits on traffic, Clarity is a great option for any size website.
Clarity’s Dashboard
Using the insights dashboard, you can see aggregate metrics that will help you better understand your website’s traffic. On the dashboard, you can easily see how many users were trying to click on links that something that is not a link, trying to click on a link that was too small, how many people scrolled up and down a page looking for information, JavaScript errors, and the average time a user spends on your site.
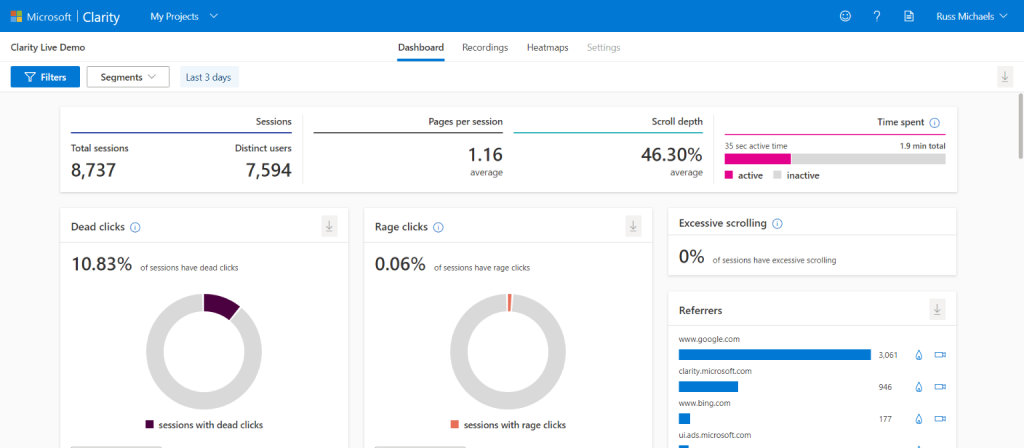
You can also use session filters (how long a user was on the site) to learn even more about user behavior. For example, you can see data in only a particular country or on a specific operating system. You could also change the timeframe to see performance information for different times of the day.
Session Recordings
Do you want to know how people interact with your website? Session playbacks are an excellent resource for website managers. With session playbacks, you can see if users are clicking on your links, CTAs, and more to better understand what is working for your website and what isn’t.
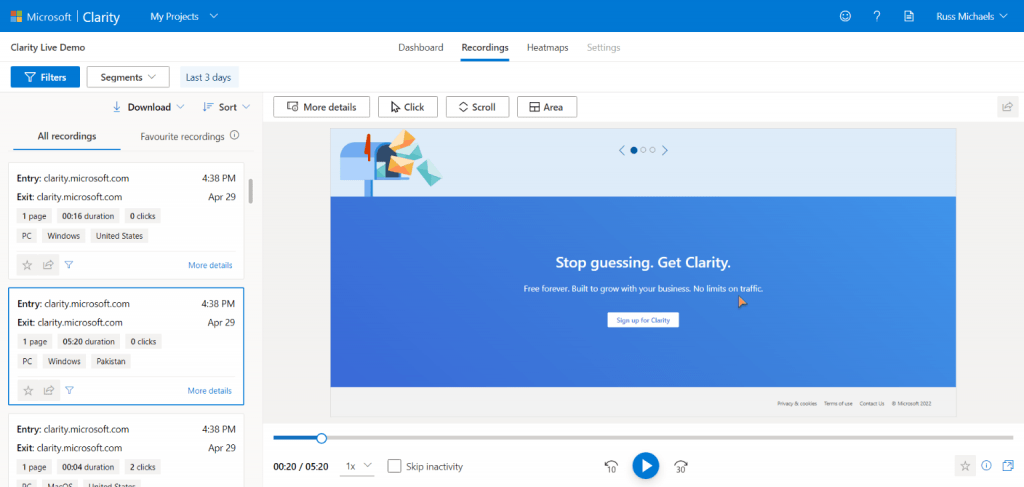
These playbacks also help you see novel patterns like “rage clicks” and “excessive scrolling” during your users’ sessions. Rage clicks are clicks that a user makes on a portion of your page that they think should link to another page or website. When you see these kinds of clicks, it is a good indicator that you need to provide a link because your website is non-intuitive.
When it comes to pricing these kinds of tools, the number of recordings you get and the amount of storage time is a huge driver of cost. This is why Microsoft launching a free tool with seemingly unlimited recordings and 12 month’s of storage is a game changer. Of course their onedrive cloud storage platform will have helped with this.
It’s hard to tell if the data value Microsoft (and ultimately Bing Search) gets from this tool, will truly keep Clarity free forever, but as of right now it seems to have a street value of well over $300/month. For digital agencies managing multiple websites the value could be worth much more.
View Heatmaps of Your User’s Webpage Browsing
Heatmaps can be incredibly important for companies to see what people care about when viewing your website. With Clarity, you can see both clickmaps and scrollmaps.
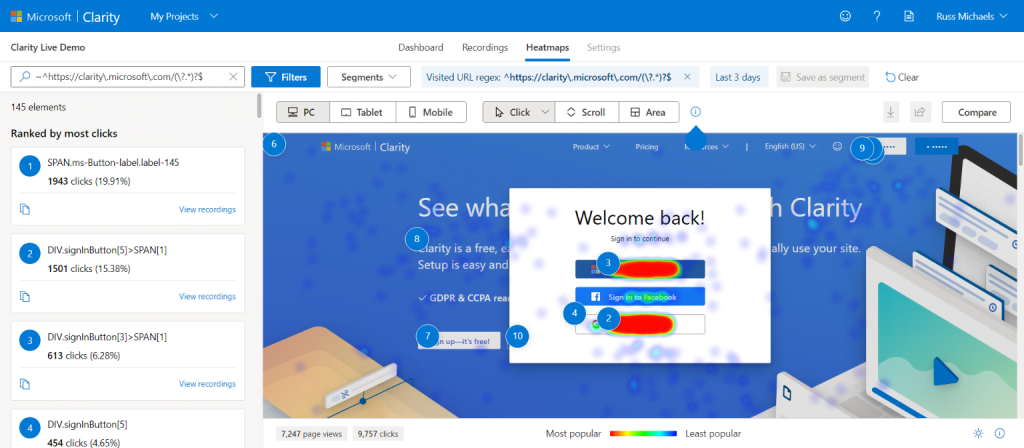
Clickmaps show you what content is the most important to your users and better for desktop view of user engagemetn.
Scrollmaps are better for mobile view and shows you when people stop and what is most important on your pages.
Either way, you can see exactly what your visitor are interacting with to determine if your design is successful or how modify your website to encourage the user behavior you want.
Clarity aggregates these two different types of data into their heatmaps so that you can quickly see important behaviors and trends that your users are displaying on your pages.
Filters
Clarity allows you to filter your data by user info, user actions, paths, traffic, sessions, page and custom.
For some folks, analysis on the types of traffic channels is important. For example, your Paid Search ad should be reviewed and monitored differently than referral, email, or organic search traffic.
One previous complaint was the inability to filter traffic by source/campaign, but this feature has since been added, although I have yet been able to test it out. I will update this article once I have done so.
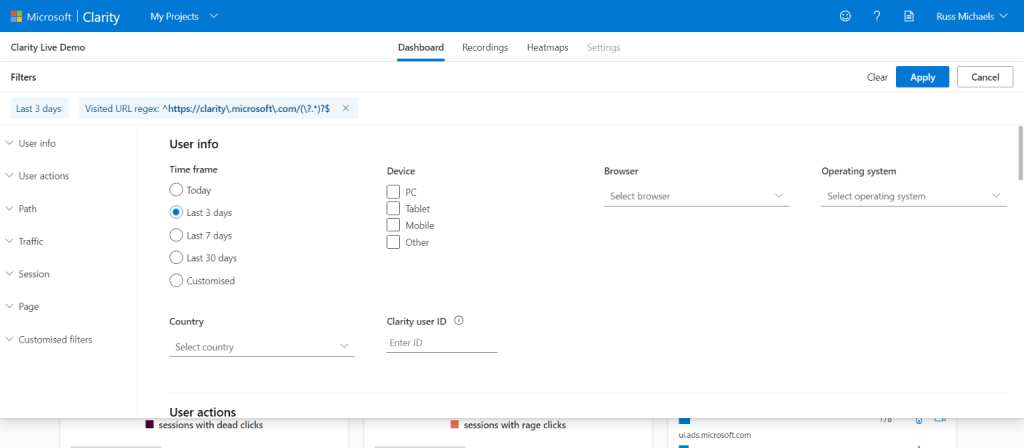
They have also added the ability to create segments.
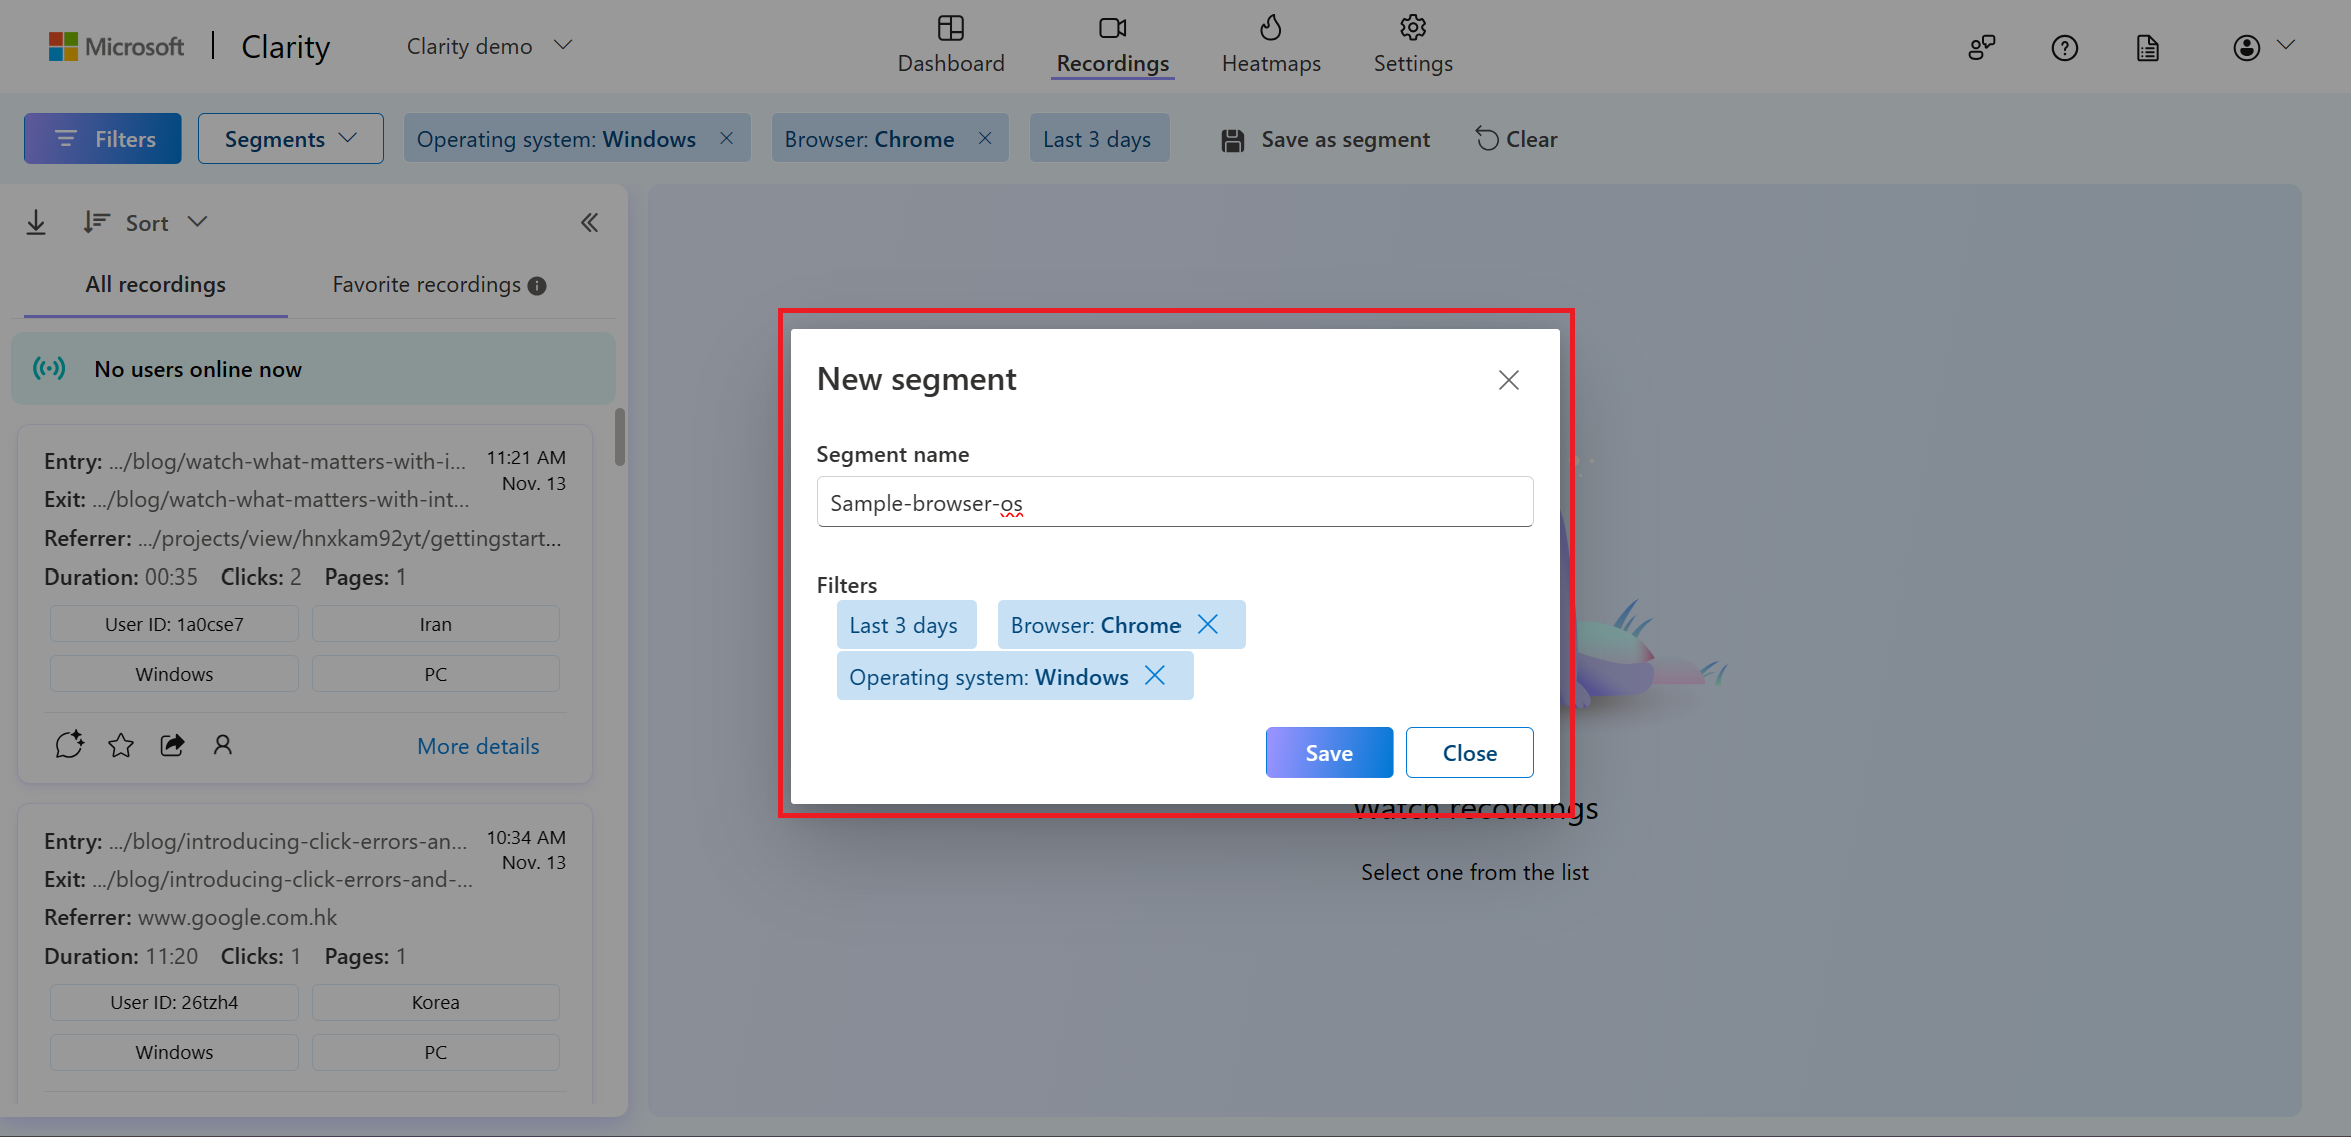
To avoid multiple manual typings, you can save groups of filters into segments. Segments can be applied to filters and custom tags.
You can create, apply, delete, clear, and upgrade a segment from any of the following features:
- Dashboard
- Recordings
- Heatmaps
What Does Microsoft Clarity Mean for Industry Software?
Clarity certainly makes tracking user data cheap and easy for the digital marketing community. And, since Clarity is similar to other services like those provided by Lucky Orange, Crazy Egg, and Hotjar, we know there is a market for this type of software.
The only cost is taking the time or paying someone for the analysis time if you cannot do it yourself. It will be curious to see what happens with this type of analytics data now that it’s free and how many companies jump on the bandwagon of actually using this for more than a novelty, but actually influencing design and UX decisions.
I have already implemented Clarity on my own websites to see how it performs and if I can use it along with Google Analytics to improve the UX on my websites and the services I provide to my customers.
You can sign up for Clarity today at https://clarity.microsoft.com.
Need Help?
if you would like me to add clarity to our website for you.


